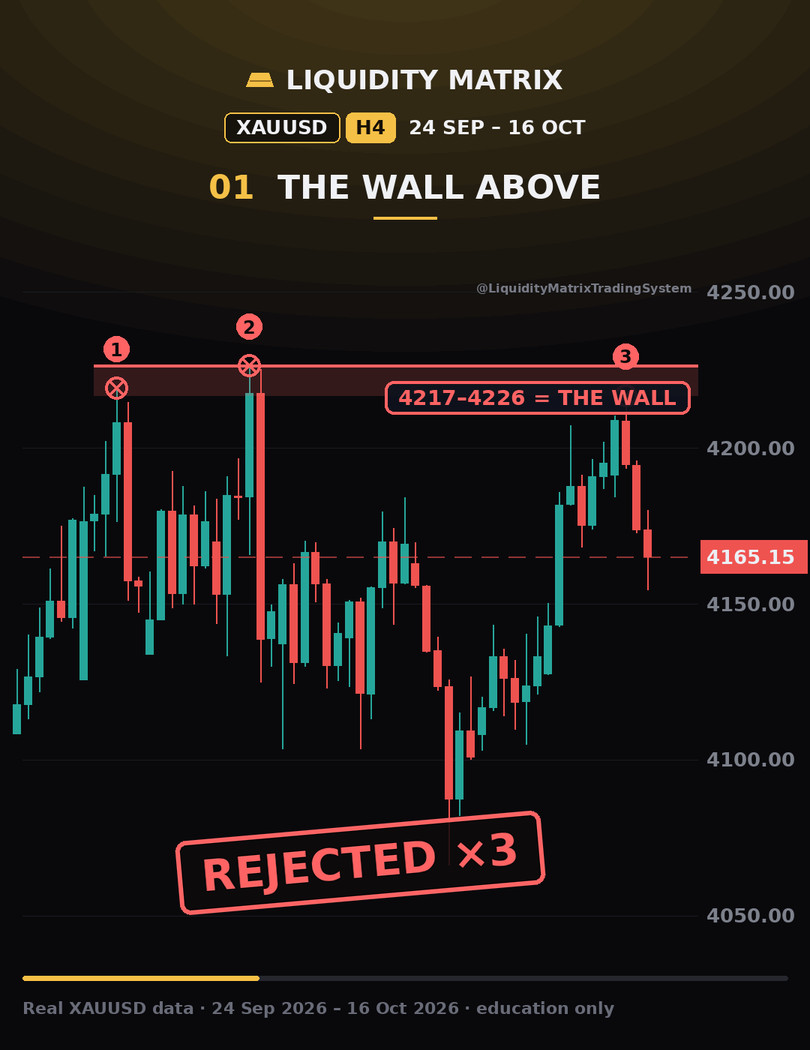
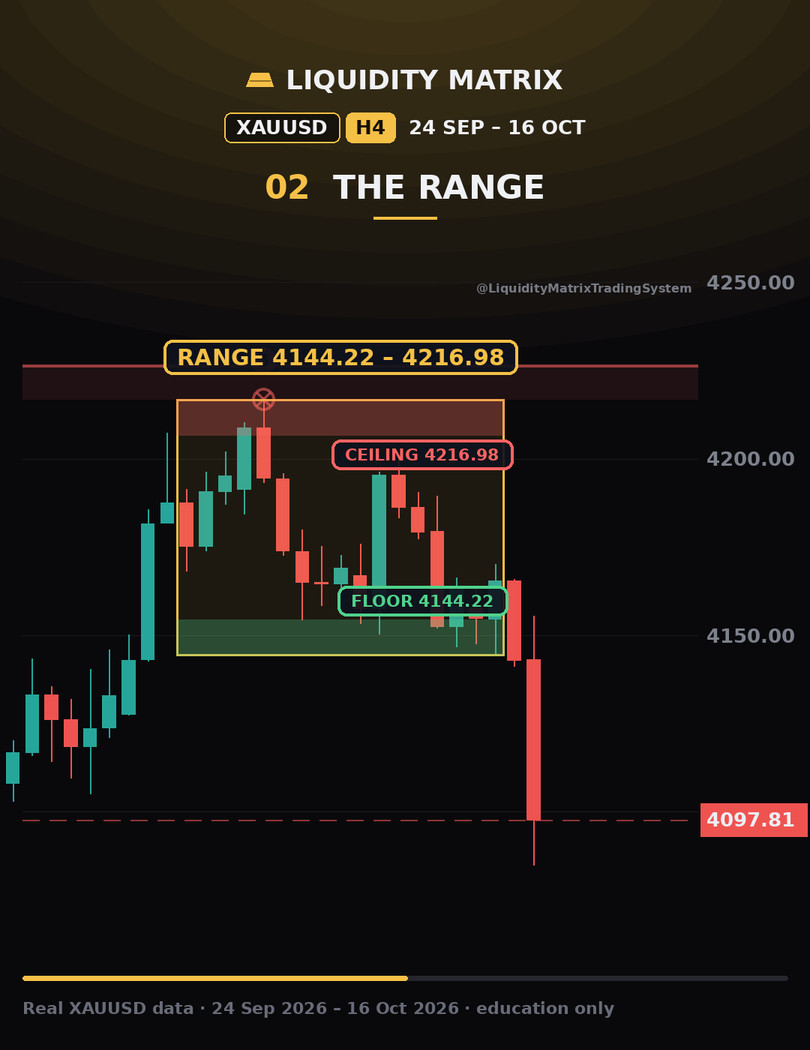
Stop being the liquidity.
See where it sits.
Every morning, code maps where stops are likely to sit in gold, silver, the major currencies, indices and Bitcoin — from real candles, with no hand-drawn lines.
Where the stops sit today
▲ nearest untouched high above the price · ▼ nearest untouched low below it. These are estimates built from the candles, not known orders: price may reach a level, break straight through it, or never come back to it.
New levels here every morning (08:00 Cairo) and at each session open. Follow for the real-chart Shorts that replay them bar by bar.
The latest educational scenarios
Straight from the public log, the moment each one is published: open, reached the target, or stopped out. Nothing is ever removed.
Built so you can check it
Real candles, real dates
Every level is found by code on MetaTrader candles, with the date it formed. Nothing is drawn after the fact.
The method →Published before the outcome
Educational scenarios are logged before price decides, and every outcome stays public — losses included.
Track record →No signals, no promises
We show where liquidity is likely to sit and what price did next. Not a signal service and not financial advice.
Risk disclaimer →
Abdelrahman Nasser
Founder · Liquidity Matrix
I trade gold, FX, indices and Bitcoin, and I build my own trading systems with code and AI.
I built this site on one rule: the map is published before price moves, and every result stays public, losses included.
Use it free, or work with us
- Daily market levels — 8 markets, every morning and at each session open, with a weekly outlook every Monday.
- Real-chart Shorts on YouTube and Instagram — the candles replayed bar by bar, with the result read from what price actually did.
- Services — Shorts for your channel, levels under your brand, trading journal reviews, prop-challenge tests and custom indicators.